
INTRODUCTION
Student-run free clinics (SRFCs) contribute to the complex fabric that makes up the social safety net for the under- and uninsured populations in the United States. Out of necessity, SRFCs often play an integral and substantial role in the long-term health management for the patients they serve. These patients, by definition, are medically vulnerable and often have various social determinants of health, reinforcing this vulnerability.1 Therefore, it is critical that SRFCs are intentional about the services they provide and continually ensure the efficacy and quality of the care provided by comparing process and clinical outcomes to national standards of care.
Previous studies have evaluated the performance of SRFCs through analysis of disease specific clinical outcomes for hypertension,2–4 hyperlipidemia,5 diabetes,6–8 and mental health.9 However, these studies on clinical outcomes and quality of care exist from only a minority of SRFCs. With over 75% of the 142 Association of American Medical Colleges institutions nationwide identified as having a free clinic,10 there exists a paucity of published research and data on this topic. It is the inherent responsibility of SRFCs who serve the most vulnerable to ensure that the care they provide is of quality that meets or exceeds national standards of care.
The Jackson Free Clinic (JFC) is an independent, non-profit student-owned and student-run free clinic (SRFC) located in Jackson, Mississippi. The JFC was designed to provide both free high-quality health care to the uninsured and homeless populations in the greater Jackson area as well as educational opportunities for health professions students at the University of Mississippi Medical Center (UMMC). The JFC primarily provides acute care with most patients (54.1%) presenting only once and a smaller percentage returning to the clinic two (13.5%) or three (7.5%) times. Approximately one quarter (24.89%) returned to the clinic four or more times.11
The JFC is primarily open on Saturdays with some specialty clinics operating on select week nights. Patients are seen either in-person as walk-ins or via telehealth appointments. All those involved in JFC leadership and clinical staff are volunteers. Medical care is provided by medical student teams, led by third- and fourth-year students, who see patients, take a history, perform a physical exam, and report to attending and resident physicians to decide on a plan of care. Pharmacy students, residents, and attendings are available on-site to assist the care teams and dispense free medications at the in-house pharmacy. The operating budget of the JFC is funded solely through donations and grants.
The JFC is located in Hinds County, which encompasses the capital city of Jackson, has a medical vulnerability index in the 71st percentile.12 With 18.7% of the population in Mississippi living in poverty and 15.4% uninsured,13 free and charitable clinics such as the JFC play an important role in increasing access to healthcare for the underserved. Mississippi experiences some of the worst rates of cardiovascular disease and diabetes in the country; 43.9% of the population experiences hypertension, 38.2% experiences hyperlipidemia, and 15.2% have diabetes.14,15 The patient population served by the JFC likely experiences similar, if not higher, rates of these diseases that have readily available and cost-effective treatments. Untreated, these diseases lead to significant adverse clinical outcomes. Therefore, quality of care analysis at local free and charitable clinics, like the JFC, is imperative to ensure adequate treatment, monitoring, and clinical outcomes for preventable conditions experienced by this vulnerable patient population.
No comprehensive longitudinal study assessing quality of care or clinical outcomes was conducted at the JFC over its now 20-year history. A previous study of the population served by the JFC determined that 40.3% of chief complaints were for health management of common conditions including hypertension, hyperlipidemia, and diabetes.11 The aim of this study is to determine if patients who receive chronic management for hypertension, hyperlipidemia, and diabetes at the JFC experienced improvement in their conditions and if their care meets national standards for maintenance and monitoring.
METHODS
A retrospective chart review was conducted by the authors (MH and JD) of all patients who either carry a diagnosis of or were treated for hypertension, hyperlipidemia, or diabetes and had at least two visits to the JFC from January 1, 2016, through December 31, 2019. During the time of the study, the JFC utilized paper charts; diagnoses were identified either from the Past Medical History, Encounter Diagnosis, or Current Medication sections of the encounter sheet. Non-identifying data including age, race, gender, and the total number of clinic visits was recorded for all patients who met the inclusion criteria for the study. Disease-specific data were collected as described below. Data was collected and entered directly into a password-protected Microsoft Excel file for storage and analysis.
The data file was stored on an encrypted and HIPAA-compliant Google Suite and is only accessible by study personnel. No direct identifiers were collected, and the data could never be linked to patients. This study’s protocol was reviewed by the Biomedical Research Alliance of New York’s institutional review board, and its exemption status was approved.
Data from the hypertension, hyperlipidemia, and diabetes cohorts were compared to the National Health and Nutrition Examination Survey (NHANES), a cross-sectional survey conducted by the National Center for Health Statistics at the Centers for Disease Control and Prevention. NHANES data sets are designed to serve as a representative sample of the U.S. population and assess its health and nutrition status, including obesity, diabetes, hypertension, cholesterol, nutrition, and dietary intake.
Longitudinal outcomes were defined as disease control metrics while under the care of the student-run free clinic that either met or failed to meet the defined national standard for control. Process measures were defined as disease management and monitoring techniques utilized while under the care of the student-run free clinic that either met or failed to meet the defined national standards of care for management.
Hypertension: Patients with a recorded diagnosis of hypertension or treatment with an antihypertensive, a recorded baseline blood pressure, and a follow-up visit with a recorded blood pressure within the study period were included. Longitudinal outcome data collected includes baseline blood pressure recorded at diagnosis or initial encounter if previously diagnosed and last recorded blood pressure. Process measure data collected includes whether a blood pressure was taken at every visit, if the patient was on at least one antihypertensive for Stage 1 hypertension or at least 2 antihypertensives for Stage 2 hypertension, and if a lipid panel and metabolic panel were ordered annually.16 Hypertension control is defined as blood pressure under 140 systolic over 90 diastolic per the standards laid out by the Eighth Joint National Committee (JNC-8).17
Hyperlipidemia: Patients with a recorded diagnosis of hyperlipidemia or treatment with a statin, a baseline low-density lipoprotein (LDL-C) cholesterol (or lipid panel), and a follow-up LDL-C (or lipid panel) within the study period were included. Longitudinal outcome data collected includes baseline LDL-C at diagnosis or initial encounter if previously diagnosed and last measured LDL-C. Process measure data collected include if the patient was receiving statin therapy, if an LDL-C or lipid panel lab test was ordered annually, and if the atherosclerotic cardiovascular disease (ASCVD) risk was documented.18 LDL-C goal was broadly defined as meeting the optimal guideline levels of either <100, <130, or <160 mg/dL as laid out by the Adult Treatment Panel III (ATP-III) report of the National Cholesterol Education Program.19 ASCVD Risk at presentation was calculated for each patient using the MDCalc ASCVD (Atherosclerotic Cardiovascular Disease) 2013 Risk Calculator from AHA/ACC.20
Diabetes: Patients with a recorded diagnosis of type 1 or type 2 diabetes mellitus or treatment with anti-diabetic medications, a baseline hemoglobin A1c (HbA1c), and a follow-up HbA1c within the study period were included. Longitudinal outcome data collected includes baseline HbA1c at diagnosis or initial encounter if previously diagnosed, and last measured HbA1c. Process measure data collected include if the patient received an annual HbA1c, if the patient received an annual nephropathy screen (including serum creatinine, urine microalbumin, or visit with nephrologist), if the patient received an annual retinopathy screening, if the patient received a one-time lipid panel, if the patient was taking at least one anti-hyperglycemic agent, and if the patient was patient taking ACE/ARB therapy.21 Diabetes control was defined as an HbA1c under 8% as defined by the Healthcare Effectiveness Data and Information Set (HEDIS) Comprehensive Diabetes Care guidelines.22
Descriptive statistics were used to describe and summarize patient demographics, disease rates, and process measure adherence. Two-tailed t-tests with a p-value of 0.05 were used in the analysis of data from the hypertension, hyperlipidemia, and hypertension cohorts. Among patients in the hypertension cohort, initial and final blood pressures were analyzed for each of the ACC/AHA Blood Pressure Categories (t-test, N=10). Among patients in the hyperlipidemia cohort, initial and final LDL-C were analyzed for each of the ATP-III LDL-C level classifications and risk categories (t-test, N=5). And among patients in the diabetes cohort, initial and final HbA1c were analyzed for each of the American Diabetes Association (ADA) diabetes classification groups (t-test, N=8). Selected control rates and process measures were derived from similar analyses of NHANES survey data.23–25
RESULTS
A total of 326 patients were included in this study. The average age of patients across all study cohorts was 51 years, ranging from 20 to 75 years old. Fifty-four percent of patients were female and 46% were male. Seventy-five percent of patients were African American, 17% were White, 4% were Hispanic, and 3.5% were Asian, which is representative of the overall population of the JFC.11 The average number of clinic visits per patient during the study period was 6, ranging from 2 to 28.
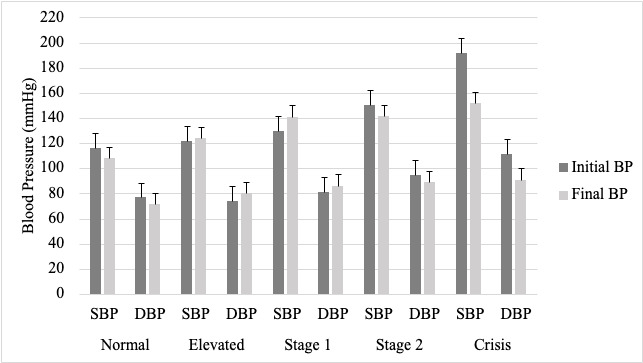
Hypertension: A total of 320 patients met the criteria for inclusion in the hypertension cohort (normotensive N=3, elevated N=8, stage 1 N=41, stage 2 N=223, crisis N=45). The average number of visits for patients in this cohort was 6. Initial and final recorded BPs were stratified by ACC/AHA Blood Pressure Categories at presentation (Figure 1). One hundred twenty-six patients (39.4%) achieved BP control. The percent of patients in each category achieving control is as follows: normotensive 100%, elevated 75%, stage 1 46.3%, stage 2 39.9%, crisis 12.3%. Statistically significant reductions in systolic (SBP) and diastolic (DBP) blood pressures were observed for patients who presented with stage 2 hypertension with a mean initial SBP of 150 to mean final SBP of 141 and mean initial DBP of 95 to mean final DBP of 89 (N=223, P<0.001) and hypertensive crisis with a mean initial SBP of 192 to mean final SBP of 152 and mean initial DBP of 112 to mean final DBP of 91 (N=45, P<0.001). Interestingly, an increase in SBP from mean initial of 130 to final of 141 (N=41, P<0.001) and diastolic from mean initial of 81 to mean final of 86 (N=41, P<0.05) was observed in individuals presenting with stage 1 hypertension. This data was compared to the National Health and Nutrition Examination Survey (NHANES) data for blood pressure control (Figure 2). In the hypertensive cohort, 24.4% had comorbid diabetes and 21.2% had comorbid hyperlipidemia.
_from_patients_with_hypertension_at_the_jac.png)

The number and percentage of patients who received the defined process measures was found to be as follows: 295 patients (92.2%) had a recorded BP at every visit; 20 out of 41 (48.8%) patients who presented with stage 1 hypertension were on at least one antihypertensive; 157 out of 268 (58.6%) patients who presented with stage 2 hypertension or greater were on at least 2 antihypertensives; 154 patients (48.1%) received an annual lipid panel; and 237 patients (74.1%) received an annual metabolic panel. The average number of antihypertensive medications per patient was 1.7, with the largest number of patients (126; 39.3%) taking one antihypertensive (Table 1).
Hyperlipidemia: A total of 69 patients met the criteria for inclusion in the hyperlipidemia cohort. Sixty-one patients fit the parameters (age 40-75) for ASCVD risk calculation (low N=20, moderate N=19, high N=22). The average number of visits for patients in this cohort was 10. Initial and final LDL-C were stratified by the ATP-III LDL-C level classifications and risk categories. Statistically significant reductions in LDL-C levels were observed for patients who presented with high levels of LDL-C from an initial of 171 to final of 136 (N=10, P<0.05) and very high levels of LDL-C from an initial of 210 to final of 135 (N=9, P<0.01). Significant reduction in LDL-C was observed only for individuals with a low calculated ASCVD risk (N=20, P<0.01). Forty-nine patients (71.01%) achieved the goal LDL-C for the respective risk category. The percent of patients in each category achieving control is as follows: low 100%, moderate 75%, high 46.3%. This data was compared to the NHANES data for blood LDL-C control (Figure 2). In the hyperlipidemia cohort, 98.5% had comorbid hypertension and 46.4% had comorbid diabetes.
The number and percentage of patients who received the defined process measures was found to be: 43 (62.3%) received an annual LDL or lipid panel, 64 (92.8%) were on a statin, and 32 (46.4%) had a calculated ASCVD risk score documented. The majority of patients were taking atorvastatin (46), followed by lovastatin (7), rosuvastatin (4), pravastatin (2), and simvastatin (2). The average number of lipid-lowering medications per patient was 1.0, ranging from 0 to 3 medications (Table 2).
Diabetes: A total of 83 patients met the criteria for inclusion in the diabetes cohort (good control N=43, moderate control N=10, poor control N=30). The average number of visits for patients in this cohort was 8. Eighty-two (98.8%) of the patients meeting inclusion criteria were type 2 diabetics. Forty-eight (57.8%) achieved control. The percent of patients in each category achieving control is as follows: good 86%, moderate 40%, poor 23.3%. Initial and final HbA1c levels were stratified by American Diabetes Association (ADA) diabetes classification and HEDIS guidelines for diabetes control. Statistically significant reduction in HbA1c level was observed in patients presenting with poor blood glucose control from initial HbA1c level of 11.4 to final level of 9.7 (N=30, P<0.001). This data was compared to the NHANES data for HbA1c control (Figure 2). In the diabetes cohort, 94.0% had comorbid hypertension and 38.6% had comorbid hyperlipidemia.
The number and percentage of patients who received the defined process measures was found to be as follows: 76 (91.6%) received an annual HbA1c, 68 (81.9%) received an annual serum creatinine level, 3 (3.6%) received an annual urine microalbumin, 21 (25.3%) received a one-time urine microalbumin, and 75 (90.4%) received a one-time lipid panel. Thirty-four patients (41%) were on insulin, and 68 patients (81.9%) were on an angiotensin-converting enzyme inhibitor (ACEi) or an angiotensin receptor blocker (ARB). Zero patients had confirmed annual ophthalmology or podiatry exams performed or documented. Twenty patients (24.1%) had a documented referral to an external ophthalmology clinic or assistance program. The average number of anti-diabetic medications per patient, including insulin, was 1.7 with a plurality of patients (34; 41%) taking 2 anti-diabetics (Table 3).
DISCUSSION
The overall care provided at the JFC resulted in rates of disease control comparable to or greater than the uninsured NHANES group (Figure 2). It is unclear what factors influenced the Stage 1 hypertensive patients to have an increase in blood pressure. While it is potentially a product of selection bias or other confounding factors related to our patient population’s access to care, this question is outside of the scope of the data collected.
Clinical adherence to standard process measures for each of the 3 diseases examined varied widely (Tables 1-3). An identifiable pattern for why certain process measures were adhered to closely by care teams relative to others is not apparent; however, this variability likely stemmed from the inherent operational limitations of a volunteer-staffed clinic that is only open once a week with variable physician staffing and limited access to specialty care services.
Since the collection of this data, steps have already been made to address some of the noted deficiencies in care. Notably, an electronic health record was adopted; standardized checklists based on up-to-date clinical care guidelines were developed for the top 25 most common diagnoses seen at the JFC to help guide student-led management of patients. The JFC has continued to add new services, including ophthalmology, gynecology, lifestyle medicine, and social health services.
At the same time, JFC patient volumes have grown by more than 346% since 2010.26 One study published in 2019 found that free clinics like the JFC reduced Emergency Room visits by 0.39 visits per patient per year.27 According to a commercial claims data set made available by the Health Care Cost Institute, the average price of an emergency department visit in 2019 in Mississippi was $460.89.28 For the JFC, with 1,919 visits in 2021, this translates to an estimated savings of $345,000 for hospitals in the state of Mississippi that year. The JFC’s operating expenses amounted to $49,031 in 2021.29 For every $1 spent to operate the JFC, the community saved $7 in reduced uninsured ER visits. This is in addition to the value of the medical, dental, psychiatric, obstetric, ophthalmologic, social health, and other services provided to patients.
The JFC is just one component of the complex fabric that makes up the social safety net in Mississippi, but continued investment and increased support of the JFC and similar free clinics is justified by both the cost-savings to the state as well as the quality of care provided to the patients. This study demonstrates that the JFC can deliver high-quality care with outcomes comparable to traditional clinics serving similar populations in a cost-effective manner for the state of Mississippi. The JFC does this all while training the next generation of doctors, dentists, dental hygienists, physical and occupational therapists, and nurses in the state and serving its most vulnerable populations.
Several limitations of this study exist. This study was conducted at a single student-run free clinic location limiting its generalizability. It was a retrospective review of student documented paper medical records. The small cohort sizes limit statistical power and external validity of this study. The exclusion of patients lost to follow-up potentially biases this study to include only patients who are more likely to be adherent to treatment plans. No control group was able to be analyzed for comparison due to the independent standing of the JFC in relation to the University of Mississippi Medical Center and other area hospitals. Additionally, patients could have received care from multiple sources during the study period including other free and charitable clinics, emergency rooms, and specialty care clinics contributing to their outcomes.
This study contributes to the existing body of literature suggesting that SRFCs are able to produce clinical outcomes for uninsured patients comparable to those produced by traditional primary care clinics.2–9 It is the inherent responsibility of free and charitable clinics to continually examine their own services ensuring the provision of high-quality care and to initiate measures to improve health outcomes for these medically vulnerable and high-risk patients.
ACKNOWLEDGEMENTS
We would like to thank the students and physicians from the University of Mississippi Medical Center Departments of Internal Medicine and Family Medicine for their volunteer time in providing high-quality care to our patients. Authors report no conflicts of interest.